
2025年10月18日雅思小作文示范写作: 动态混合图 某国家18-34年龄段人口占比&地区分布
每场雅思考试之后,第 一时间分享本场考试雅思A类大作文的范文权威解析。欢迎每周锁定。
12025年10月18日雅思小作文题目
he graph and pie charts below show the percentage of population aged between 18 and 34 years old in a particular country and the percentage of this age group of people living in different regions from 1978 to 2011.

22025年10月18日雅思小作文范文及解析
开头段
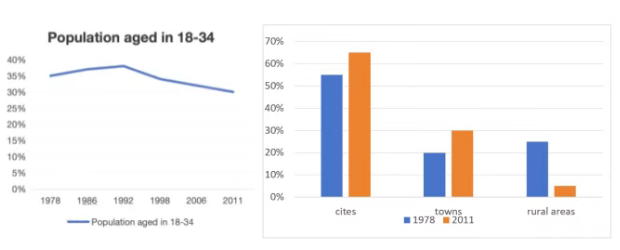
The line graph illustrates the proportion of the population aged 18 to 34 in a certain country from 1978 to 2011, and the bar chart compares the geographical distribution of this age group across urban, town, and rural areas in 1978 and 2011.
概述段
Overall, the surveyed age group experienced a falling trend over the given period. With more people migrating to cities and towns, the changes in their demographic distribution reflected the broader trend of urbanization.
思路要点:
- 18-34岁的人口比例整体下降
- cities、towns的人口比例上升,rural areas人口比例下降
Body paragraph 1
From the line graph, it is obvious that the share of 18-to-34-year-olds started at 35% in 1978. After a modest rise to a peak of 38%in 1992, this figure dropped significantly to just 30% in 2011.
思路要点:
- 1978年:35%
- 随后逐步上升,1992年达到峰值38%
- 随后显著下降,到2011年达到30%
Body paragraph 2
In terms of the geological distributibution of this age group, we can see from the bar chart that in 1978, 55% of the people lived in cities, roughly twice the proportion in rural areas(25%) and towns(20%). By 2011, the percentages of people residing in urban areas and towns had both increased by 10%, while those living in rural areas had plunged to just 5%.
思路要点:柱图
- 1978年,cities数值最 高(55%), 大约是rural areas(25%)、towns(20%)的两倍
- 2011年,cities、towns数值显著上升了10%,rural areas数值急剧下降到5%
雅思小作文上分Tips
小作文看着简单,但写起来却常常遇到这些问题:概括句总觉得空、不知道写哪组对比;模仿范文也写了不少,但分数始终卡在6……
这类问题其实不是“基础差”,而是缺少系统的表达框架+语言训练。暑假是集中突破小作文表达力的黄金阶段,新航道写作课程会重点带你:
读图、概括、分段,掌握各类图表写作结构;
词组句型反复练,解决“不会写”或“太单薄”;
真题图表逐句拆解+精批,稳步提升语言准确度。
10/11月报名有专属优惠!想让小作文也稳住分?扫码聊聊你的情况,看看怎么练更适合你