雅思图表类小作文开头模板解析
It is demonstrated that the + 表格类型 +gives us an illustration of + 表格内容+ (in terms of) + 时间
一般来讲,小作文的开头句都会对图表的内容进行一个概括,这个开头句基本适用于所有类型的小作文: 柱状图(bar chart),饼状图(pie chart),表格(table chart),地图(map),流程图(diagram),折线图(line chart)。
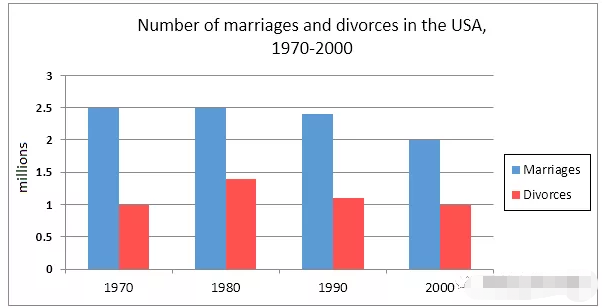
我们以下面的bar chart为例进行一下讲解:

这张柱状图非常清晰明了,描述的是美国从1970年到2000年期间结婚和离婚情况,我们来套用一下刚才的例句。
It is demonstrated that the bar chart gives us an illustration of number of marriages and divorces in the USA between 1970 and 2000.
在表格内容的部分,我直接照抄了题目,及number of marriages and divorces in the USA,实际上,还可进行词汇和搭配上的升级,我们来看看升级后的版本:
It is demonstrated that the bar chart gives us an illustration of quantites of marriages and divorces in America between 1970 and 2000.
这里我将number换成了quantities,把USA换成了America,这就是非常重要的同义词替换,这对提升作文整体水平有极大的帮助,今后我们会针对同义词替换进行专门的讲解。
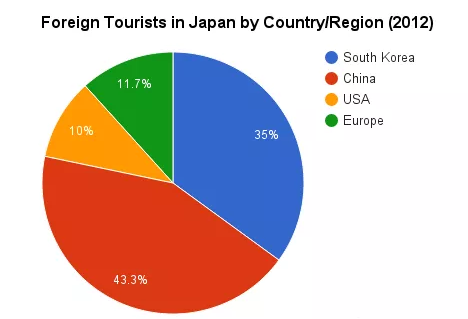
接下来,我们再来看一个pie chart,也就是饼状图。

与突出数量变化的柱状图不同,饼状图侧重于比例,这幅饼状图描述了2012年韩国,中国,美国,欧洲四个地区来日本旅游的游客所占的比例,我们来看看如何套用之前的例句。
It is demonstrated that the pie chart gives us an illustration of foreign tourists in Japan by country/region in 2012.
这句话还是照搬了题目,要想更加出彩,我们还是需要加以upgrade:
It is demonstrated that the pie chart gives us an illustration of tourists from South Korea, China, USA and Europe who travel to Japan in 2012.
这里我把整体的句型进行了升级,使用了who引导的定语从句,这样就更容易让考官眼前一亮。
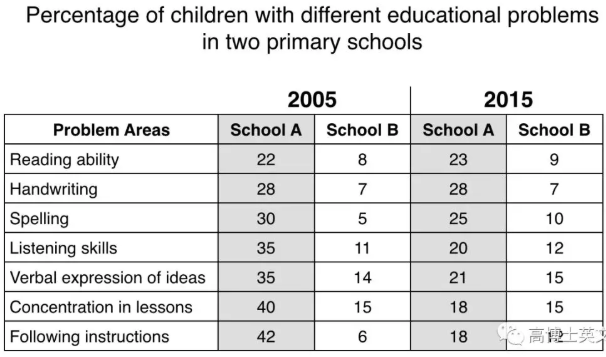
我们再来举一个table chart,也就是表格的例子。

表格图也是侧重于数据的描述及对比,上图描述的是两所小学中涉及到不同教育问题的孩子所占的比例,
It is demonstrated that the table chart gives us an illustration of percentage of children with different educational problems in two primary schools between 2005 and 2015.
接下来再看看升级后的版本:
It is demonstrated that the table chart gives us an illustration of proportion of students who have distinct issues in terms of education of two primary schools between 2005 and 2015.
这个版本升级中,我将同义词替换和句式转换进行了结合,percentage换为proportion,children换为students,different换为distinct,problems换为issues,句式方面用了who引导的定语从句。
以上就是上海新航道梳理的小作文句子内容,希望对大家的雅思写作有一定帮助。如在学习过程中有问题或者想咨询课程的话,欢迎拨打电话:4008-125-888


