2018年02月01日雅思小作范文参考范文(外教版)
Task1:
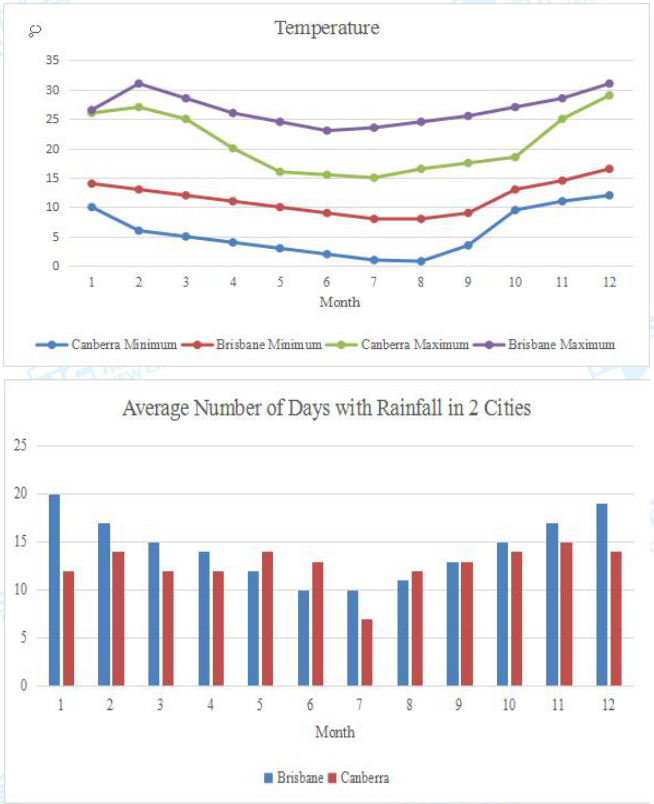
The graphs show the average maximum and minimum temperatures between Brisbane and Canberra and the average number of days with rainfall in these two cities. Summarise the information by selecting and reporting the main features, and make comparisons where relevant.

参考范文
The line graph presents how the average maximum and minimum temperatures in Canberra and Brisbane change, while the bar chart compares the average number of their raining days in a year. The hottest weather in both Brisbane and Canberra take place over the period from December to next February. Normally, Brisbane has similar maximum temperature to Canberra. However, the minimum temperatures between these two cities witness a gap of about 5 Celsius. Compared with Brisbane, the lowest temperature in Canberra can be as low as 10 Celsius in summer. After February, both cities become increasingly cool, entering winter month from June to August. Temperatures in Brisbane are obviously higher than that of Canberra, with a gap of around 10 Celsius. These two cities begin recovering after August till they approach summer again. It is mentionable that Brisbane has much more days of raindrops than Canberra, expect three months including May, June and August. Overall, from the analysis of temperature and raindrops of two Australian cities, it can be easily seen that Brisbane, with milder temperature and better humidity, is more livable than Canberra.
TIPS:
每场雅思考试结束后
我们会同步更新(每周一)
由唐伟胜老师编写的
雅思大作文范文
02月01日雅思大作文范文,请:2018年02月01日雅思大作文题目解析+参考范文
需要2018.02.01雅思机经的同学请:2018.02.01雅思完整机经回忆


