
剑11Test3雅思写作task1题目+范文-CO2排放趋势图
剑11Test3雅思写作task1题目+范文-CO2排放趋势图
剑11Test3雅思写作task1题目:
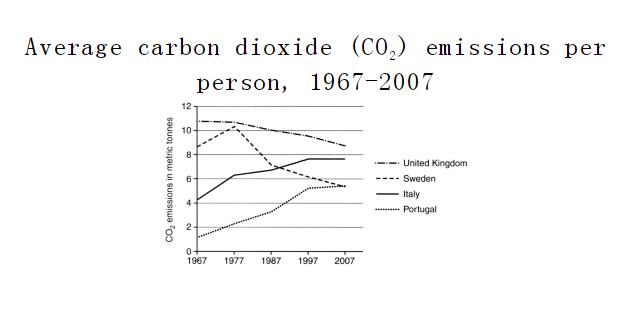
The graph below shows average carbon dioxide (CO2) emissions per person in the United Kingdom, Sweden, Italy and Portugal between 1967 and 2007. Summarise the information by selecting and reporting the main features, and make comparisons where relevant.
a)解析:包括回答中需要讨论的主要特征、需要进行的对比以及考生可能对题目产生的错误理解。8要点1.学生应该写出在四个欧洲国家中二氧化碳人均排放量的变化趋势。2.学生应该对这些趋势做出相应的比较。8错误理解1.学生在写作的时候可能会用现在时而不是过去时。2.学生写作时有可能过多地注意细节而不是主要特征。3.学生有可能忘记写单位。
b) 雅思写作范文(一):
The graph shows the average CO2 each person emits in four different countries: the UK, Sweden, Italy and Portugal over a 40- year period beginning in 1967. From the chart we can clearly see that Sweden and the UK have had a general downward trend. In Sweden, however, between the years 1967 and 1977 it did increase slightly from a little over 8 metric tonnes to over 10 metric tonnes. The Swedish decline was considerably more than that of the UK and actually nearly halved its output with the figure in 2007 showing a little under 6 metric tonnes. Both Italy and Portugal, steadily increased the emissions, with Portugal showing the greatest rise from a little under 2 metric tonnes in 1967, to nearly 6 metric tonnes by 2007. In summary, we can see that the overall amount of emissions recorded in 1967 is less than those of 2007.
这个图表描述的是四个国家的人均二氧化碳排放量,即英国、瑞典、意大利和葡萄牙从1967年起的40年间的数据。从图表中我们可以明显看到,瑞典和英国呈现了一个总体下降的趋势。然而,在瑞典,从1967年到1977年,它确实从8公吨多缓慢增长到了10公吨以上。瑞典的下降要比英国下降得更快一些,它的结果实际上已经被腰斩,在2007年的数据还不到6公吨。意大利和葡萄牙的人均碳排放量都是逐步增长,葡萄牙的增长幅度,从1967年的不足2公吨增加到2007年的将近6公吨。总之,我们可以看到1967年的碳排放总量要低于2007年的数量。
c) 雅思写作范文(二)
The line chart shows four different countries CO2 emissions between the years 1967 and 2007 as a per person average measured in metric tonnes. The countries listed are the United Kingdom, Sweden, Italy and Portugal. Beginning in 1967 we can see that there is a large difference in the starting points of all of these countries. The UK had the greatest amount, starting at approximately 11 tonnes per person, whereas Portugal was about one tonne per person. Over the 40 years, the UK gradually decreased its emissions, however, Portugal had a general increase with the final figures showing approximately 9 tonnes and 5 ½ tonnes, respectively. Looking at the remaining 2 countries, Sweden and Italy, they both rose significantly in the first 10 years; however, whereas Sweden then continually declined over the next 30 years, Italy steadily increased in the same time period, with Sweden’ s end result approximately 2 tonnes less than Italy’ s, despite Sweden having started at 4 tonnes more per person. We can see overall that even though all of the countries began with very different figures, the final results show that everybody is now emitting a vaguely similar amount.
这个折线图描述的是从1967年到2007年不同国家的人均二氧化碳排放量(单位:公吨)。图中所列的国家分别是英国、瑞典、意大利和葡萄牙。从1967年开始,我们可以看到所有这些国家的起点有很大的差距。英国的排放量,人均约达到11公吨,而葡萄牙却只有人均1公吨。经过40年之后,英国的排放量逐渐减少,而葡萄牙却整体上升,它们的最终数量分别是9公吨(英国)和5.5公吨(葡萄牙)。再来看其他的两个国家:瑞典和意大利。二者在前十年间都有显著增长,然而虽然瑞典随后30年间持续下降,意大利却在同一时期稳定增长,结果瑞典的最终结果低于意大利2公吨,虽然瑞典开始时要比意大利多4公吨。我们可以看到,总体而言,虽然所有的国家开始时的起点各不相同,最终结果却表明各国的人均排放量都是大体一致的。
这个暑期,来新航道 上海雅思辅导班 ,我们给考生的保障
签订协议,承诺不过重修,只有的雅思培训学校,才敢做出如此承诺!
自信,源于上海新航道完善的雅思培训 体系
13年来,我们专心做好一件事
那就是如何让学员顺利通过雅思考试