雅思小作文必看!动态柱组合图范文:澳大利亚四个城市住房租金对比
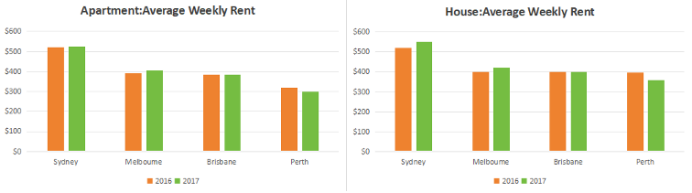
该柱状图展示了2016年至2017年间,澳大利亚四个主要城市——悉尼、墨尔本、布里斯班和珀斯——的公寓与房屋平均周租金对比情况。数据清晰地反映了不同城市、不同住宅类型在两年间的租金变化趋势,为我们了解澳大利亚主要城市住房市场的价格差异提供了直观依据。

The chart below shows average weekly rent for apartment and houses in four Australian cities in 2016 and 2017.
主体段分段方法:
主体1:Sydney,Melbourne(上升趋势)
主体2:Brisbane、Perth(下降趋势)
开头段
The bar charts compare the average weekly rental costs for apartments and houses in four Australian cities (Sydney, Melbourne, Brisbane, and Perth) in 2016 and 2017.
概述段
Overall, house rents were more expensive than apartment rents across all four cities. Meanwhile, Sydney consistently had the highest rental costs for both types of accommodation, while Perth had the lowest rents throughout the given period.
思路要点:
四个城市的house租金都高于apartment租金
两年内,Sydney的apartment和house租金都,但Perth都
Body paragraph 1
Two cities saw a rising trend in rental costs. Specifically, Sydney ranked the top, with the average cost of apartments rising slightly from $520 to $530, while that of houses growing remarkably from $520 to $550. Melbourne followed a similar trend, with apartment rents rising modestly from $390 to $405 and house rents increasing from $400 to $420.
思路要点:Sydney,Melbourne
这两个城市的租金都呈上升趋势
Sydney:apartment和house租金都,apartment租金 由$520 小幅上升到$530,house租金由 $520 小幅上升到$550
Melbourne:呈现类似趋势;apartment和house租金分别为由$390小幅上升到$405、$400 到$420
Body paragraph 2
By contrast, Perth saw a decrease in rents for both housing types. Its weekly cost for apartments dropped moderately from $310 in 2016 to $300 in 2017, whereas house rents fell significantly from $400 to $350 over the same period. In addition, Brisbane was the only city to maintain stable rent levels, staying at $380 for apartments and $400 for houses.
思路要点:Perth,Brisbane
Perth:两种住房租金都下降;apartment租金从$310小幅下降到$300,house租金从$400显著下降到$350
Brisbane:两种租房租金保持平稳,分别为$380和$400
总体来看,四年城市中房屋租金均高于公寓租金,悉尼无论公寓还是房屋都位居租金,而珀斯则处于水平。在变化趋势上,悉尼和墨尔本两类住房租金均呈现上升,珀斯则显著下降,布里斯班保持平稳。这些差异不仅体现了各城市房地产市场的供需特点,也为租客和投资者提供了重要参考。