雅思小作文混合图范文推荐:电脑使用
Computer Use
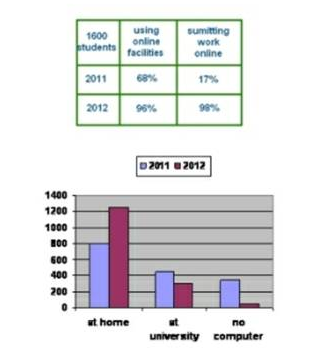
The charts below show information about how 1600 university students use computers.
Summarise the information by selecting and reporting the main features, and make comparisons where relevant.

Sample Answer
【标题改写】
The table andbar chart tell us about computer use by a group of students.
【描述表格】
The table shows that, of 1600 students, 68% used online facilities in 2011 and that this figurehad risen significantly to 96% the following year. Over the same time period, the percentage of students submitting work online increased dramatically from 17% to 98%. (同类数据一年内的变化)
【描述柱图】
The bar chart shows us where the students used computers. In 2011, 800 students used computers at home, but by 2012 this figure had risen by over 50% to 1250 students.The number of students using computers at university decreased by a third from 450 in 2011 to 300 in 2012. The number of students without computers fell substantially from 350 in 2011 to only 50 in 2012. (同类数据一年内的变化)
【总结表格之间的信息联系】
To sum up, more of the students used computers for their studies in 2012 than in the previous year, withmany students switching from using computers at the university to using them at home or getting a computer fortheir studies. (总结数据体现出来的趋势变化) (167words)
Vocabulary
rise significantly显著地增长dsx
submit v.提交
increasedramatically 大幅度增加
figure n.数字
decreased by athird 减少了三分之一
(decrease/increaseby+ fraction :减少/增加了几分之几)
fallsubstantially 大幅下跌
previous adj. 先前的
switch from … to… 从…变化为…


