雅思小作文饼图范文推荐:人口类话题
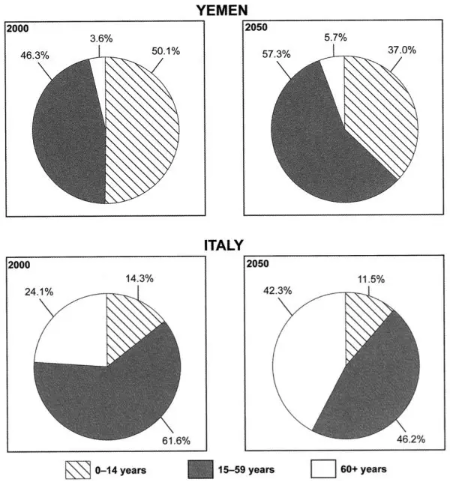
The charts below give information on the ages of the populations of Yemen and Italy in 2000 and projections for 2050.

也门和意大利两国“0-14岁”,“15-59岁”和“60岁及以上”人口比例,2000年和2050年的数据。
按国家(横着)还是时间(竖着)写?
本质上来讲,两种都是可行的,但是强烈推荐考官的写法。这篇文章没有考官范文,但是剑桥雅思7 Test 4和这个题目如出一辙,就是按国家(横着)来写的。所以,这篇范文也是依据考官采用的结构,按国家来写的。
是否要写趋势?
看得出,这是一幅动态图,因为某个年龄段的人口比例随着时间变化。假如考官范文没有写趋势,你会写吗?同意建议,按照考官的做法,不写。所以,这是“当做静态图来写的动态图”。
文章结构?
两个主体段,一个写“也门”,一个写“意大利”;在每一个主体段内,前半部分写“2000年”,后半部分写“2050年”(标准的剑桥雅思7 Test 4考官范文的结构)。
时态?
描述2000年数据时用一般过去时,描述2050年数据时用一般将来时或者表示预测的词(predict, expect, project)。
精选范文:
The charts show the populations of Italy and Yemen in 2000 and their predicted populations in 2050, broken down by age range and expressed as percentages of the whole national population.
In 2000, children aged under 14 years old were the largest group in Yemen, representing 50.1% of the whole population. People between 15 and 59 years old accounted for 46.3%, while the percentage of older people (60 years old and above) was very small, at only 3.6%. In 2050, the 15-to-59-year-old group is predicted to be the largest of the three, accounting for 57.3%, when the seniors and younger children will constitute 37.0% and 5.7% respectively.
In Italy, younger children (0-14 years old) only constituted 14.3% in 2000, while the elderly represented a larger percentage (24.1%). The rest of the population (61.6%) were all aged between 15 and 59 years old. This age group is projected to almost equal the oldest one (42.3%) in 2050, accounting then for 46.2%. The remainder (11.5%) will be younger children.
In sum, the largest groups of both Yemenis and Italians are expected to remain between 15 and 59 years old.
常见坑
0-14岁 (children between 0 and 14 years old, children aged 14 and below)
错写成:teens/ teenagers / adolescents (13-19岁),children (13岁及以下全体)
15-59岁 (people between 15 and 59 years old)
错写成:middle aged people, adults aged between 15 and 59 (15-19不属于adults)
不要以为不写趋势,文章会变得很简单。其实语句重复性会很高,因为你会重复一句话:
“xx国在xxxx年xx年龄段的人占xx比例。”
除了上面内容之外,还有必要学习一下饼图写作小技巧噢!
饼图在表达时无非是两个表达的组合“占”和百分比。
“占”:
Occupy
Account for
百分比:
A small percentage of … (X%)
A quarter of …
The minority of … (X%)(小部分)
Half of …
The majority of … (X%)
Most of … (X%)
One-fifth of …
A possible answer:
The pie graph demonstrates that heating rooms and water occupies the majority of electricity consumption (52.5%). Then, 17.5% of the electricity demand is shared by ovens, kettles and washing machines. Lighting, TV, radio and vacuum cleaners, food mixers, electric tools are responsible for the rest, with 15% each.


