支招小作文(57) | 【柱图 1】不同年份 多一种比较
数据图:【柱图】
主要描述【比较】,可能描述变化。
时间在【不同的年份】。

【Introduction】
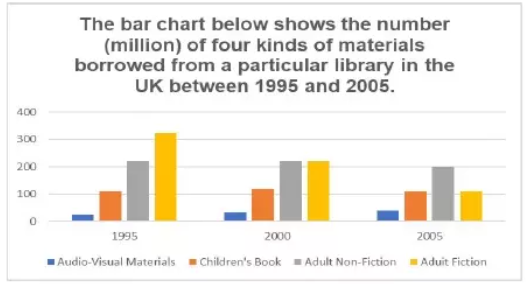
第1句话说明图的大意:Shown In the chart are three sets of bars that illustrate how many times four kinds of materials were lent by a particular library in the UK in 1995, 2000 and 2005.第1句话中注意下划线部分是引起了一个倒装句(主语和系动词位置颠倒的倒装),这种倒装结构可以当成模板套用。同时注意:柱、饼图惯用bar,线图惯用graph。The general pattern is evident. Audio-visual materials, children’s books, and adult nonfictional books showed steadiness compared with adult fictional books.第二句话说明图的最宏观最直观的特点。
【Body】
老章在观察后,发现前三根bar应该放在一起写,因为在这三年里,这三根bar的数字基本没变过,特点相似,放在一起写方便读者理解,也给自己省事:The numbers of the first three materials were roughly 20 million, 100 million and 200 million respectively in 1995, and the other two years saw only negligible variations in each number. 第1句话的写作逻辑是:先说明第1年,再以第1年为参照物去说明后面两年没怎么变。至此,前三根bar的宏观特点写完了。Not only the overall stability, it is also notable that the library loaned audio-visual materials significantly fewer times than it loaned other materials.这一句话是补充说明前三根bar当中,还有什么特殊的地方。这个特殊的地方体现出【比较】,也就是fewer。于是,这就形成了这个段落的写作结构“总—分”,即“先写三个在一起时的宏观,再写三个当中的特殊”。
另起一段单独写最后一根bar,肯定多用些笔墨:Adult fiction is different from the first three types of materials, as its number varies vastly from year to year. 第1句话说明了【比较】,也通过与前三根bar的比较关系来承上启下连接两个段落。In fact, the decrease is apparent: 300 million times in 1995, 200 million times in 2000, and only 100 million times in 2005, 这前半句就是罗列数字。这种写法很省劲,全文总会用到一次两次,没问题。同时,注意冒号的用法,即解释说明冒号前的内容的具体情况。and the decline represents the loss of the exclusive high popularity in 2000 and even of its leading status in 2005.这后半句有难度,尝试学会,不然的话就用最傻的“谁和谁一样”去写,不出彩,但就也行。
【Conclusion】
In general, the overview of the graph is the evident changing number of one type of material and the stability of the other three types.
结尾段建议有。一句话宏观的方式、粗线条的方式总结主体部分。虽然这个句子的表意不容易被想出来,但是完全不难理解,并且可以当成写作模板学会和择机套用。
【全篇而言,尤其主体部分】
词汇注意:高亮标出的表达程度的形容词和副词、已经带有程度意义的动词和一些特殊动词、表示“稳定”或“改变”的名词。
句法注意:通过使用不同的主语来丰富句子的模式,以及用来联系上下文的句型。


